
You'll need this:
-
One of these Pointerpro plans:
 Professional Enterprise ReportR DistributR
You can choose between a few different formats:
- Fixed Format - Using this option allows downloading survey responses in a pre-formatted CSV, Excel or PDF format.
- Configurable Format - Using this option requires the ReportR plan to pre-configure your report templates and subsequently download the response(s) according to the specific format you defined in the template.
By default, our dashboards allow for displaying up to 5000 responses. If you have more than 5000 responses and you want to analyze them in the charts tab, you'll need to add filters to limit the number of responses. As for exporting the dataset via CSV or Excel, you'll get the full set of data if you remove your filters.
If you have multiple filters, the first filter is applied to all your data (returning up to 5000 responses), the next filter will then be applied to these 5000 and not the total dataset.
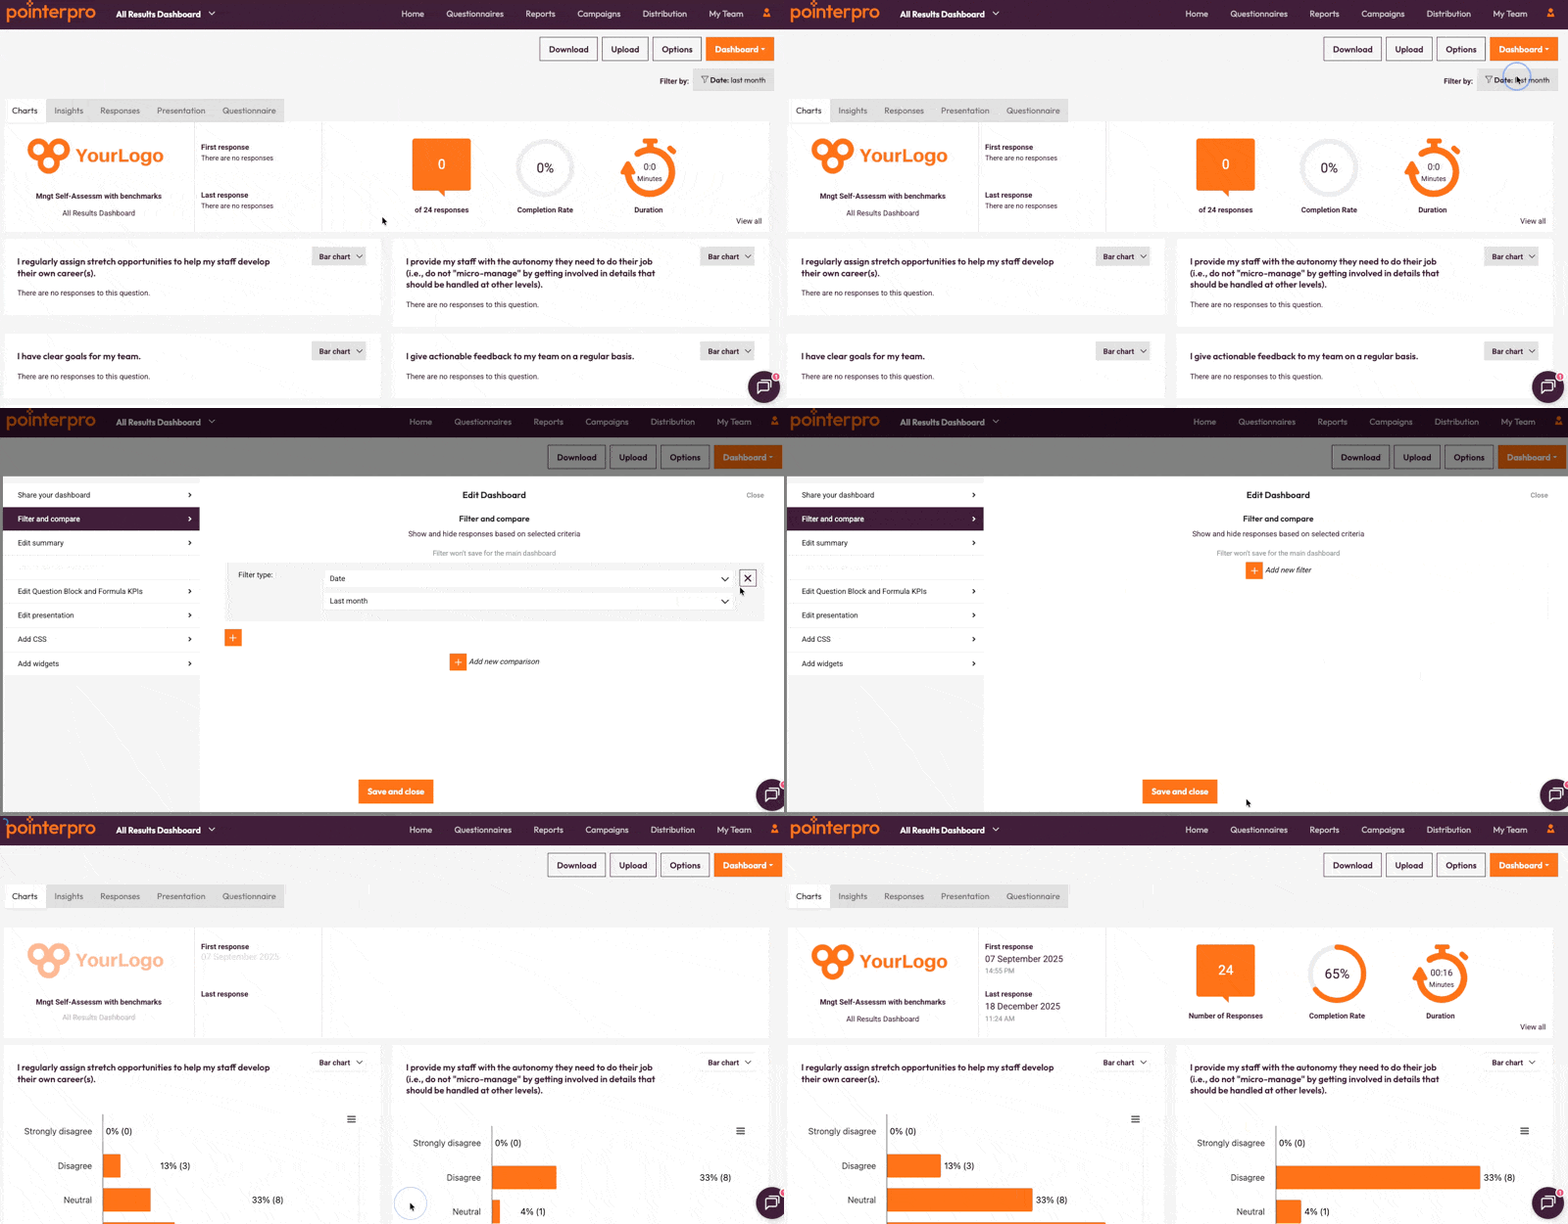
By default, the dashboard displays data from the past month. To view and load all results, simply click on the filter, and press the X to delete the filter that only shows the past month's data. Make sure to click save and close to save the changes you've made to the filter settings.
On this help guide page:
1. Fixed format downloads
1.1 CSV file
1.2 Excel file
1.3 PDF file
1.4 Report scheduler
The CSV, Excel, or PDF files are generated based on your dashboard. If you have applied a filter to the dashboard, only those results fulfilling the filter criteria will be included.
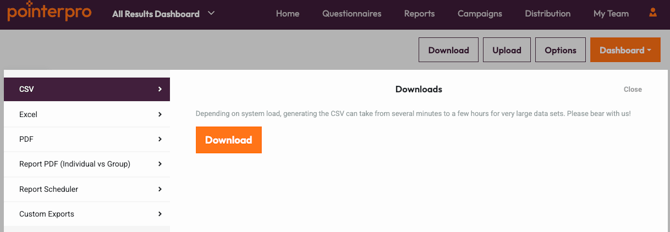
Start by heading over to the Results section. There are two ways to do this, either click on the responses icon on the Home screen or click the Results tab in the question editor. Click Download in the top right corner.
1.1 CSV file
To get your CSV file, which includes all results, select CSV, enter your email and simply click Download.
When the CSV file has been generated, you can either open or save the file. When the CSV is to large to be generated immediately, it will be sent by email.
Learn how to convert the CSV file to an Excel file.
1.2 Excel file
Click Excel on the left-hand side, type your email and then simply click Download. Then a box will pop-up where you can either open the file immediately or save it for later.
1.3 PDF file
If you want a ready-made report of all survey data, including charts, summary tables, and respondent data, choose the PDF option.
You will receive a link to the PDF by email. Make sure your email address is spelled correctly! Choose how you want to customize your PDF.
You can only use the email link to the PDF once. If you need another PDF file, have another link sent by clicking on the PDF button again. If you didn't receive the email, check your spam folder. PDF links will expire 24 hours after generation so that the link can be used more than once in those 24 hours.
You can customize your PDF by turning on different features:
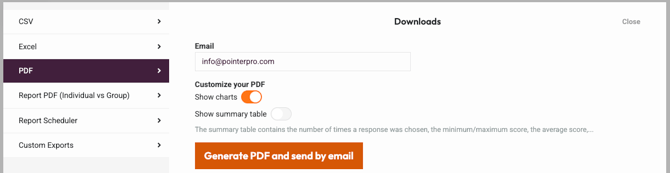
- Show Charts: the PDF will contain one chart per question.
- Show Summary table: this table will show the number of times a response was chosen, the minimum and maximum score, average score, etc.
The "Show Response tables" feature can only show a maximum of 100 responses. If the survey has more than 100 responses, this feature is turned off automatically. This is because the PDF can't display all those responses. In such situations, it's advised to download the responses using a CSV/Excel file.
1.4 Report Scheduler
If you want to get a copy of the reports in your email on a recurring basis, you can set up the Report Scheduler.
Click Report Scheduler on the left side, and click Create Scheduler.
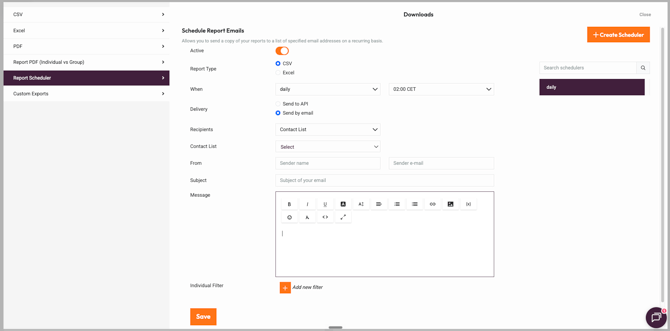
- Activate/ deactivate the scheduler
- Chose the report type - CSV or Excel
- Set up the time - when should it be sent
- Select where it should be sent - API or email
- Type in your subject and message, and select who you want to send it to. Note that variables can be included in the subject, message and the recipients.
You can also add a filter to your Report scheduler. Don't forget to save it!
1.5 Response Detail PDF
This option allows you to get a PDF that displays all the survey questions, possible answers, and the responses given by a particular respondent.
When you're in the Results section, click the Responses tab. You'll see a table with rows of individual responses. Click on the Details icon to view a particular response.
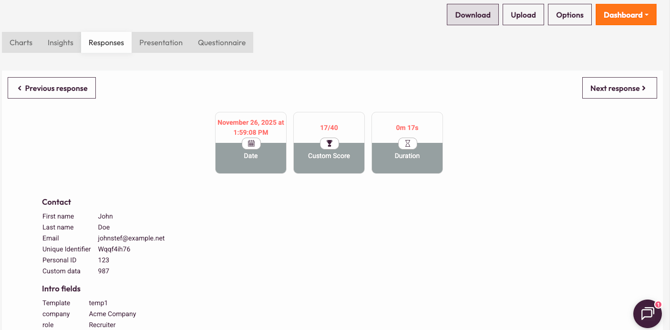
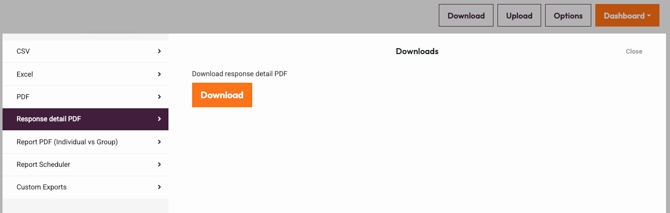
While you are viewing an individual response, you can get that response as a PDF by clicking Download and then selecting Response detail PDF and clicking Download. A PDF will be produced for you to open or save.
2. Configurable format downloads
2.3 ReportR PDF (Individual vs. Group)
2.1 ReportR PDF (Individual)
This feature is available if you're on the ReportR plan. If you have created a personalized PDF report for a particular questionnaire, you'll see an extra option to get a ReportR PDF. This will allow you to have the PDF report of that particular response after having selected the PDF report and the Output Format (PDF or .pptx).
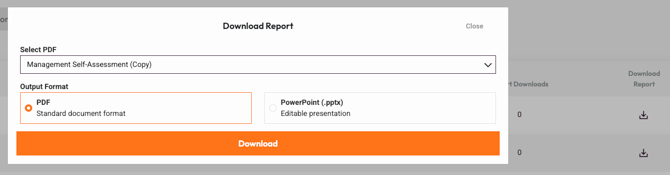
You can also download the individual report from the Downloads window after clicking the Downlaod button in the results screen. In that case, you can specify a filter to select the response the report should be created for.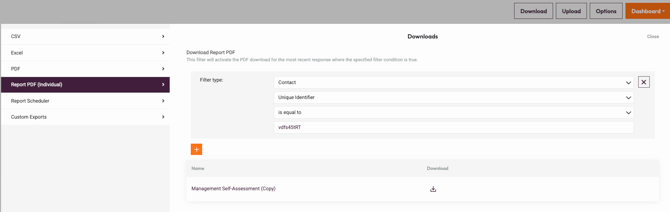
If you add a filter, the system will download the latest response that meets this criteria. Click the arrow to access the drop-down menu of all of the possible parameters you can use for the filter. You can click the orange button again if you want to add extra filters, which will be in addition to (AND) or instead of (OR) the first filter that you set up.
2.2 Report PDF (Group)
Aggregated reports are an extra feature with an additional fee. Don't hesitate to get in touch with sales@pointerpro.com for additional information.
If your plan is ReportR and you are using the Aggregated Reports feature, here is where you can download your Group reports.
From the filters dropdown, you can select a predefined filter or create new filters by selecting the Custom filter. You can add as many filters as you want by clicking on the + button.
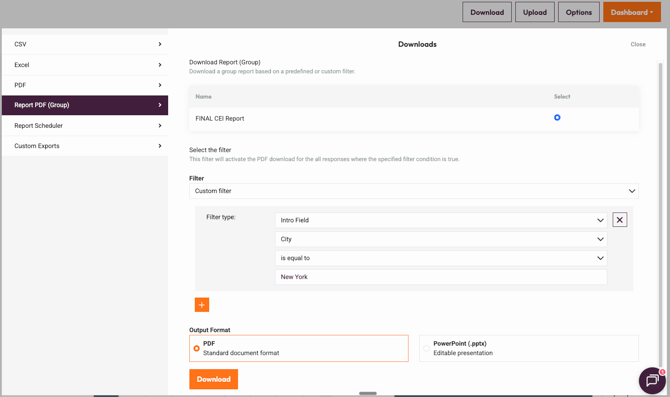
Once you've applied your filters, click on the Download button.
2.3 Report PDF (Individual vs Group)
Aggregated reports are an extra feature with an additional fee. Don't hesitate to get in touch with sales@pointerpro.com for additional information.
If your plan is ReportR and you are using the Aggregated Reports feature, here is where you can download your Individual vs Group reports.
You can select the PDF you want to download the report for, and then use separate filters for the Individual and for the Group.
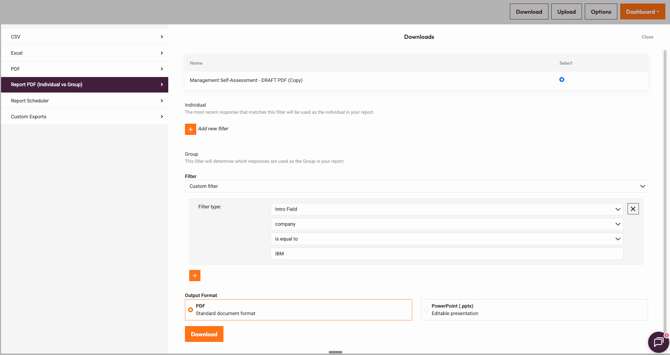
You can select your predefined filters or select the Custom filter from the dropdown menu and add as many filters as you want by clicking the + button.
Once you've applied your filters, click on the Download button.
What's next?
- Use Google Analytics to capture extra data that will allow you to make analyses across different channels. For example, to check if there are discrepancies between your website visitors and your social following.
- Zapier integration - Zapier is a tool that enables the transfer of data from one web app to another. By using Zapier in combination with Pointerpro, you can send the data collected within your survey to create contacts in Pointerpro or send data to apps such as Google Sheets, Mailchimp, Salesforce, Trello, and many more.
- Make integration - With the Pointerpro integration, you have loads of possibilities of actions that can be executed by Integromat when you receive a new survey response - integrate with Google Sheets, Twilio, WooCommerce, Mailchimp, Dropbox, and many more. Make offers similar features to Zapier but is more powerful as you can set a single event to trigger a number of different actions to be taken simultaneously.