You'll need this:
-
One of these Pointerpro plans:
![]() Professional
Professional ![]() Enterprise
Enterprise ![]() ReportR
ReportR ![]() DistributR
DistributR
Formula ranking widgets is very handy if you have custom formula calculations in your questionnaire and want to present formula results to the respondent in a certain order (hight to low or vice versa).
The results will be presented along with explanatory text or images directly below each formula.
Here's how a formula ranking could look like in your report:

Lets see how to configure this chart!
On this help guide page:
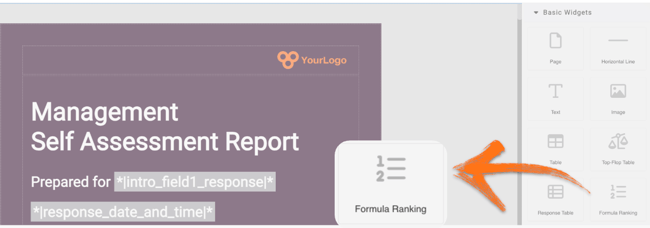
1. Add a Formula ranking widget
To add a Formula ranking widget to the page, all you have to do is click on it and drag and drop it on the page.
Once you add the widget a pop-up window will open where you can add your content.
2. Setup your widget
The main building block of this graph is KPI. Start by adding the formulas which you want to display: click Add KPI to add the first one. These are the settings you will see:


- Choose your formula from the drop-down menu. Start by adding the formulas which you want to display.
- The Description is the text which will be displayed under the result. You can also add images here.
- Click Add KPI to add as many formulas as you need.
- Toggle to show or hide the formula titles.
- Toggle to show or hide the formula results.
- Use the drop-down arrow to choose how to sort the results. Available options: No sorting (the default option), Low to High or Hight to Low.
- You can set the limit of how many formulas to show. You can add as many as you like, and then choose to limit by 3 formulas. As such, if you've added 10, only the results of the 3 highest- or lowest-scoring formulas will be shown in the PDF report.
Don't forget to click Save and close to save your setup.
You can add images and text formatting in the description.
3. Additional settings
Select the widget and then at the right of the screen click on the Settings button. The widget list will be replaced by the additional settings.
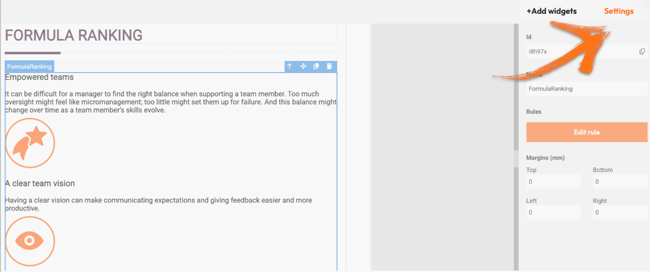
Here you can find the following settings:
1. ID
This is the ID of the widget.
2. Name
You can name your widget to identify it easier.
3. Rules
You can add your widget logic rules to ensure that your content will be visible only when the conditions are true.
4. Margins
Add margins to create space around elements and move them on your page. By default, the margins are set to 0, but you can change that anytime and add the margin you prefer.
4. Additional buttons
When you click on your widget, 4 blue buttons appear in the upper right corner.
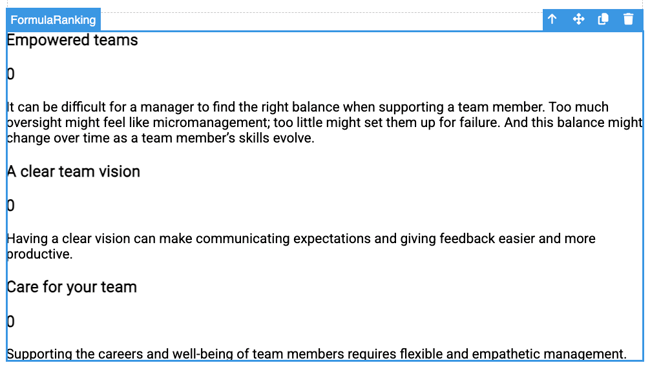
The Arrow allows you to move between the different layers of the page. For example if you add a widget in a column then you have 3 layers: the page, the column and the widget. The arrow allows you to quickly select a different layer.
The second icon, the four arrow sign, allows you to move your widget up or down to the page.
The third icon, the page, allows you to copy this widget and the forth icon, the bin, to delete it.
What's next?
- Report Builder - PDF step-by-step example: Check out our step by step guide to create an attractive and stylish PDF. It includes videos but also very detailed instructions.
- KPI Widgets: Formula KPI: Formula KPI widget allows you to display the results of formulas that you have set up. You can use this widget to have a quick visual representation the respondent results. KPI stands for key performance indicator, a quantifiable measure of performance over time for a specific objective.
- KPI Widgets: Question Block KPI: This widget shows respondents how they scored. It is most useful when you have question blocks in your questionnaire together with custom scoring. This widget allows you to easily display your dimensions in a pre-formatted chart.
Don't want to build it yourself? Contact our professional services team
