You'll need this:
-
One of these Pointerpro plans:
![]() Professional
Professional ![]() Enterprise
Enterprise ![]() ReportR
ReportR ![]() DistributR
DistributR
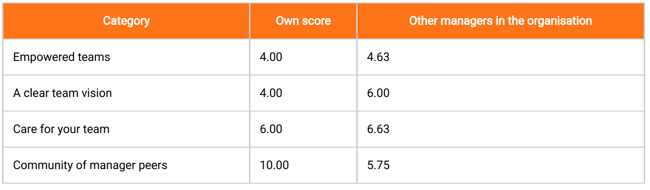
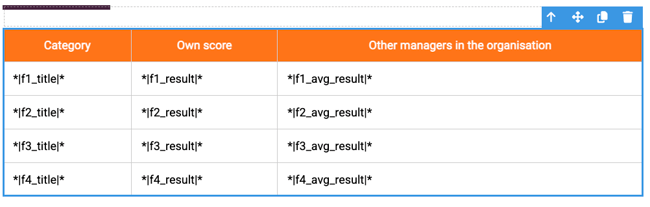
Rather than writing your data in long text, you can make it more understandable and easy to read with Table widget.
Here is an example of how this could look like:
Lets configure this widget together!
On this help guide page:
1. Add a table widget
To add a table widget to the page, all you have to do is click on it and drag and drop it on the page.
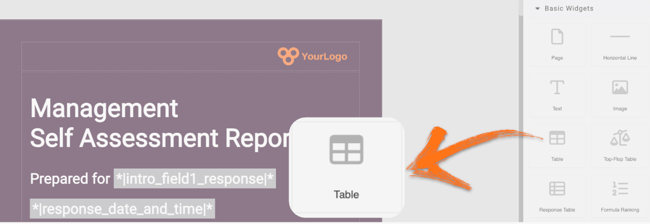
Once you add the table widget a pop-up window will open where you can add your content.
First you need to select the number of your columns and click Add Row.

The first row is usually used as header for your table, here you can add titles to your columns.
In the example below we have 3 columns.
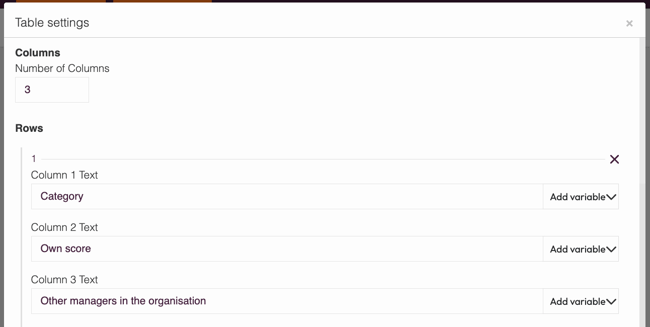
You can type in the text to the fields or you can click on the Add variable button and select your variables from the dropdown list.
In our example, we visualize data for 4 categories and we would like to show a comparison for Own score vs Other managers in the organisation. As such we select to have 3 columns and 5 rows.
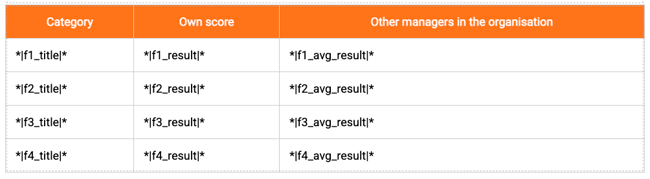
Scores for our four categories are calculated as Formulas, so we use Variables in our table cells. This is how our table widget configurations looks like:
Once you finish editing your rows, you can choose the table style. There are four options: Basic, Header, Banded or Column.
You can also change your table width at the Set Table Properties and the colors by clicking the color selectors.

Don't forget to click Save and close to keep your progress.
2. Additional settings
Select the widget and then at the right of the screen click on the Settings button. The widget list will be replaced by the additional settings.
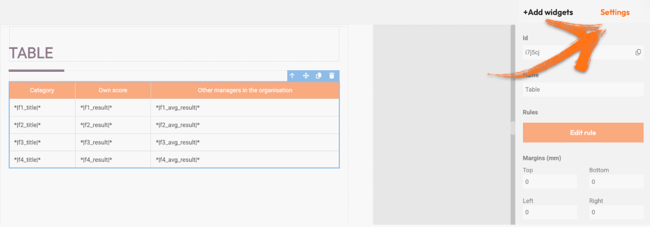
Here you can find the following settings:
1. ID
This is the ID of the widget.
2. Name
You can name your widget in order to identify it easier.
3. Rules
You can add your widget logic rules to ensure that your content will be visible only when the conditions are true.
4. Margins
Add margins to create space around elements and move them on your page. By default, the margins are set to 0, but you can change that anytime and add the margin you prefer.
3. Additional buttons
When you click on your widget four blue buttons appear to the right.
The Arrow allows you to move between the different layers of the page. For example if you add a widget in a column then you have 3 layers: the page, the column and the widget. The arrow allows you to quickly select a different layer.
The second icon, the four arrow sign, allows you to move your widget up or down to the page.
The third icon, the page, allows you to copy this widget and the forth icon, the bin, to delete it.
What's next?
- Report Builder - PDF step-by-step example: Check out our step by step guide to create an attractive and stylish PDF. It includes videos but also very detailed instructions.
- Basic Widgets: Image: This widget allows you to add pictures to your personalized report, to make it more interesting. It can be a great way to keep respondents engaged and break up long blocks of texts or lots of tables. Adding pictures, in some cases, can provide more detail than words and it can be a great way to display information!
- Basic Widgets: Text: The Report Builder text widget allows you to write and display your content in your report. You can use it to give further information about questions, give feedback or explain a particular answer. This is an absolutely essential building block of your PDF report.
Don't want to build it yourself? Contact our professional services team
