You'll need this:
-
One of these Pointerpro plans:
![]() Professional
Professional ![]() Enterprise
Enterprise ![]() ReportR
ReportR ![]() DistributR
DistributR
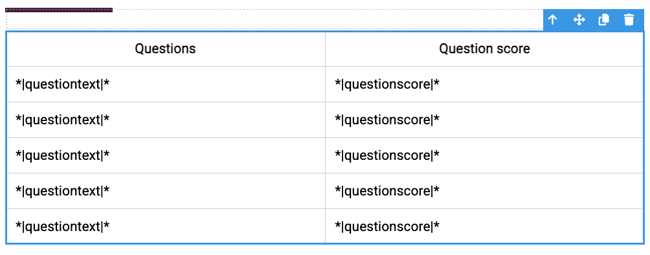
This is an example of how top-flop table chart looks like:

Lets see how you can configure it!
On this help guide page:
1. Add a top-flop table
To add this widget to the page, all you have to do is click on it and drag and drop it on the page.
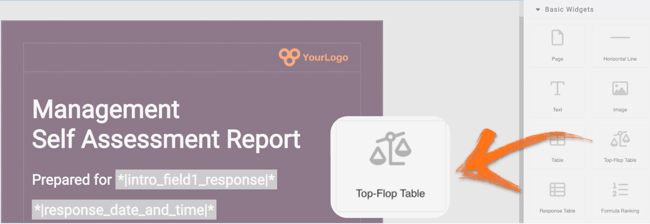
Once you add it a pop-up window will open where you can add your content.
2. Setup the widget
The highest or lowest scored questions will be displayed in the report as a table, so here's where you can configure what information you want to display.

You can click Add column to add your column names and values.
The column name will be displayed on the first row of the table to label each column. Make sure you give clear column names so that readers of the PDF report will understand what they're looking at. Use the Add variable menu to select the variable.
When you've finished setting up the table, choose which type of scores you want to show: top to show the highest scoring questions, or flop to show the lowest.
Use the limit field to control how many rows are displayed - keep your table short, sweet, and to the point, so respondents are not overloaded with information.
TIP
If you want to show both the highest scored questions and lowest-scored questions, add this widget type twice and select Top for one widget and Flop for the other one.
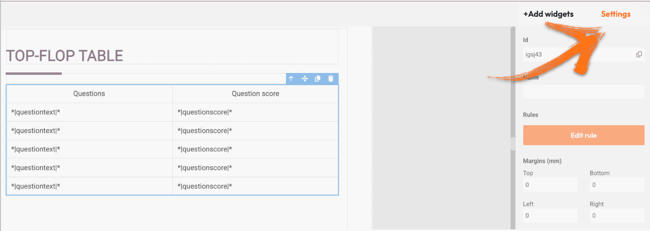
3. Additional settings
Select the widget and then at the right of the screen click on the Settings button. The widget list will be replaced by the additional settings.
Here you can find the following settings:
1. ID
This is the ID of the widget.
2. Name
You can name your widget in order to identify it easier.
3. Rules
You can add your widget logic rules to ensure that your content will be visible only when the conditions are true.
4. Margins
Add margins to create space around elements and move them in your page. By default the margins are set to 0, but you can change that anytime and add the margin you prefer.
4. Additional buttons
When you click on your widget four blue buttons appear to the right.
The Arrow allows you to move between the different layers of the page. For example if you add a widget in a column then you have 3 layers: the page, the column and the widget. The arrow allows you to quickly select a different layer.
The second icon, the four arrow sign, allows you to move your widget up or down to the page.
The third icon, the page, allows you to copy this widget and the forth icon, the bin, to delete it.
What's next?
- Report Builder - PDF step-by-step example: Check out our step by step guide to create an attractive and stylish PDF. It includes videos but also very detailed instructions.
- KPI Widgets: Formula KPI: Formula KPI widget allows you to display the results of formulas that you have set up. You can use this widget to have a quick visual representation the respondent results. KPI stands for key performance indicator, a quantifiable measure of performance over time for a specific objective.
- KPI Widgets: Question Block KPI: This widget shows respondents how they scored. It is most useful when you have question blocks in your questionnaire together with custom scoring. This widget allows you to easily display your dimensions in a pre-formatted chart.
Don't want to build it yourself? Contact our professional services team
